Client
Bright
Role
Product Designer
Year
Q1 2026
Overview
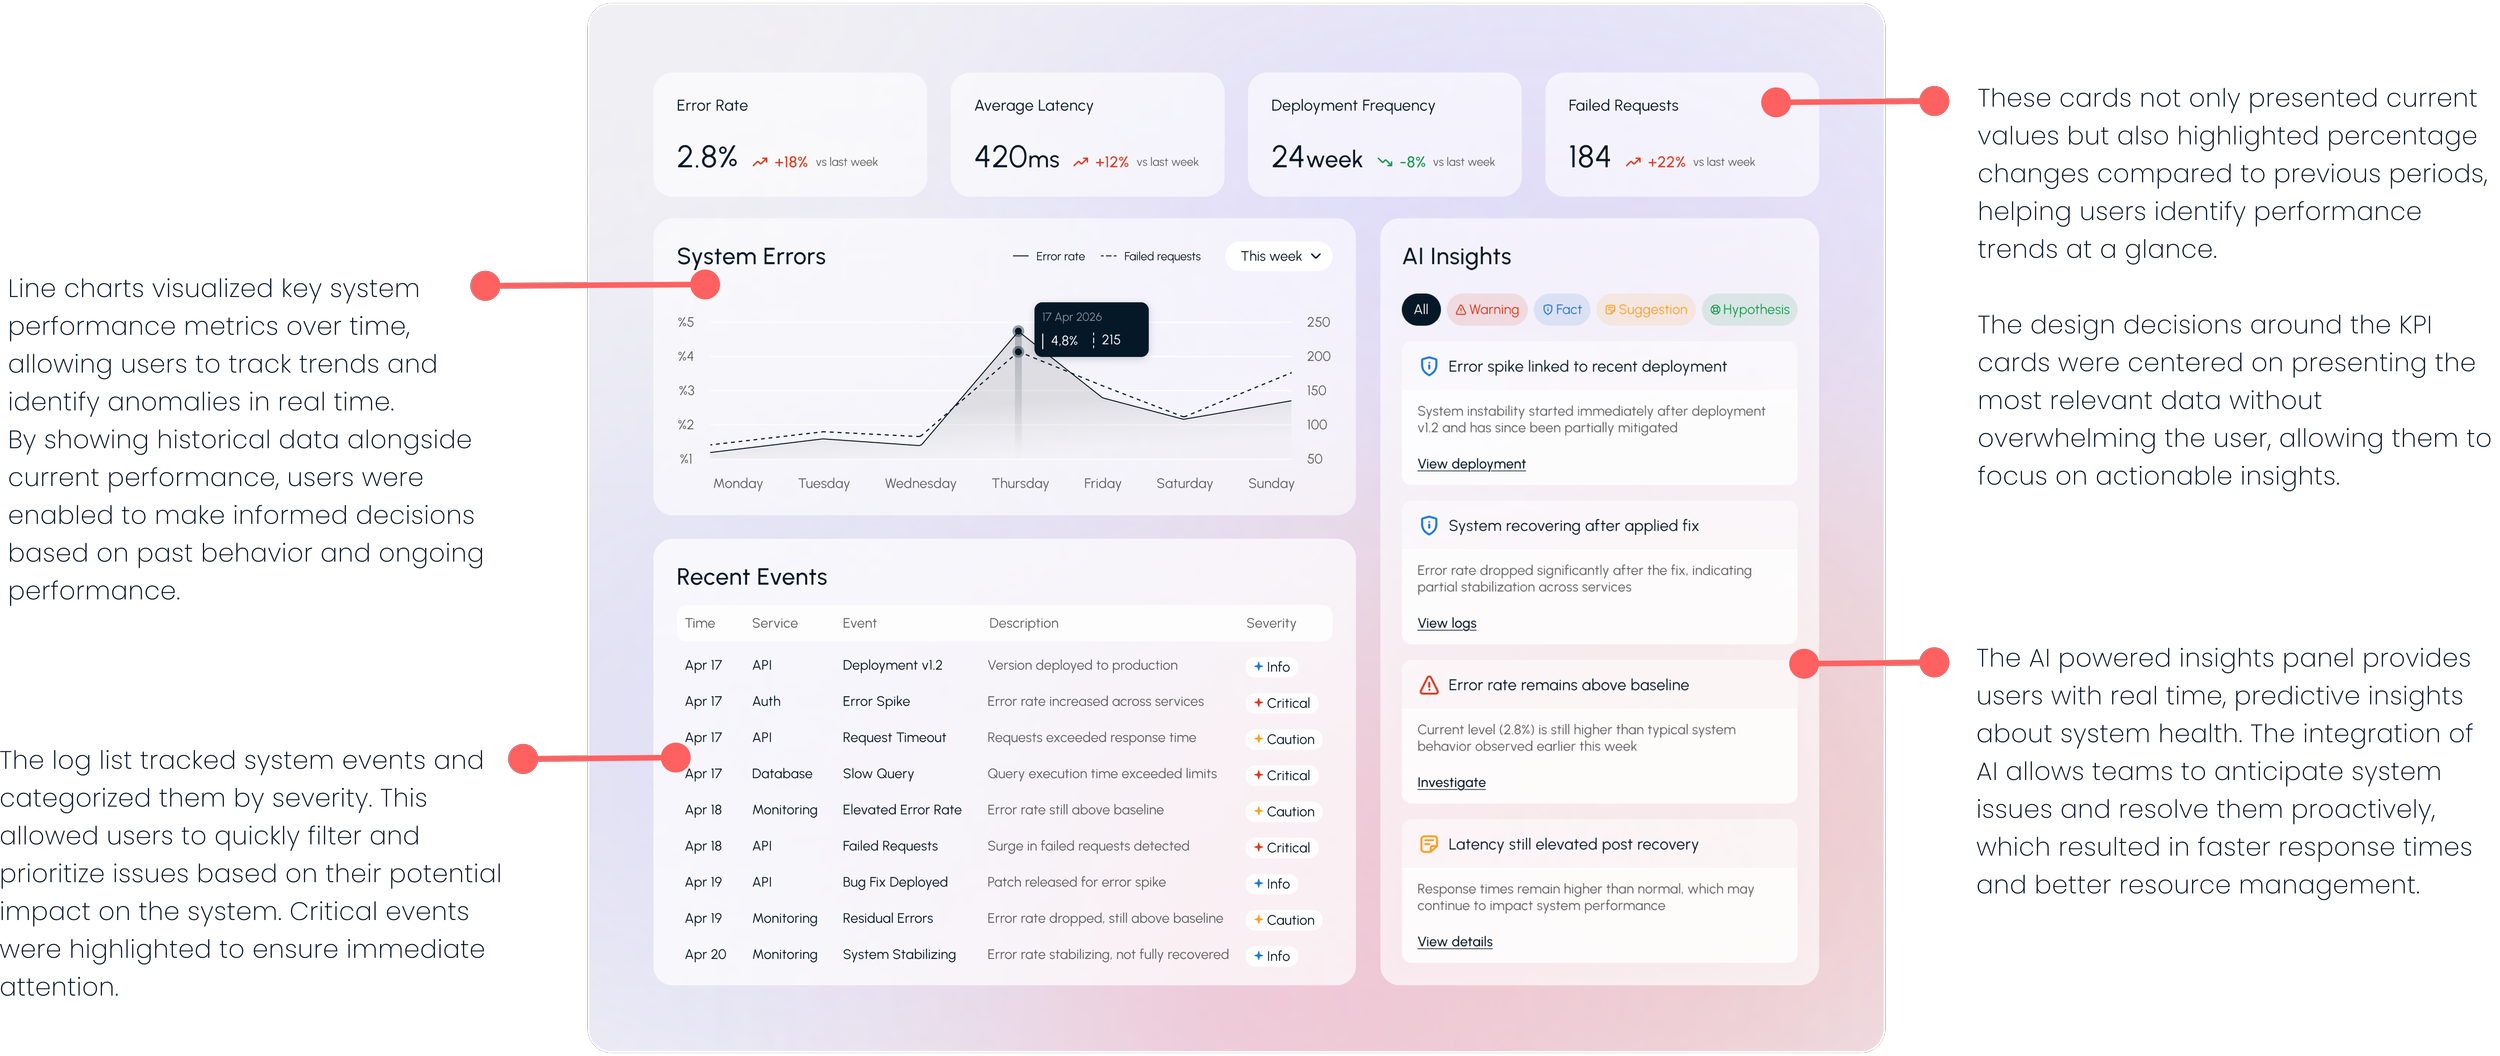
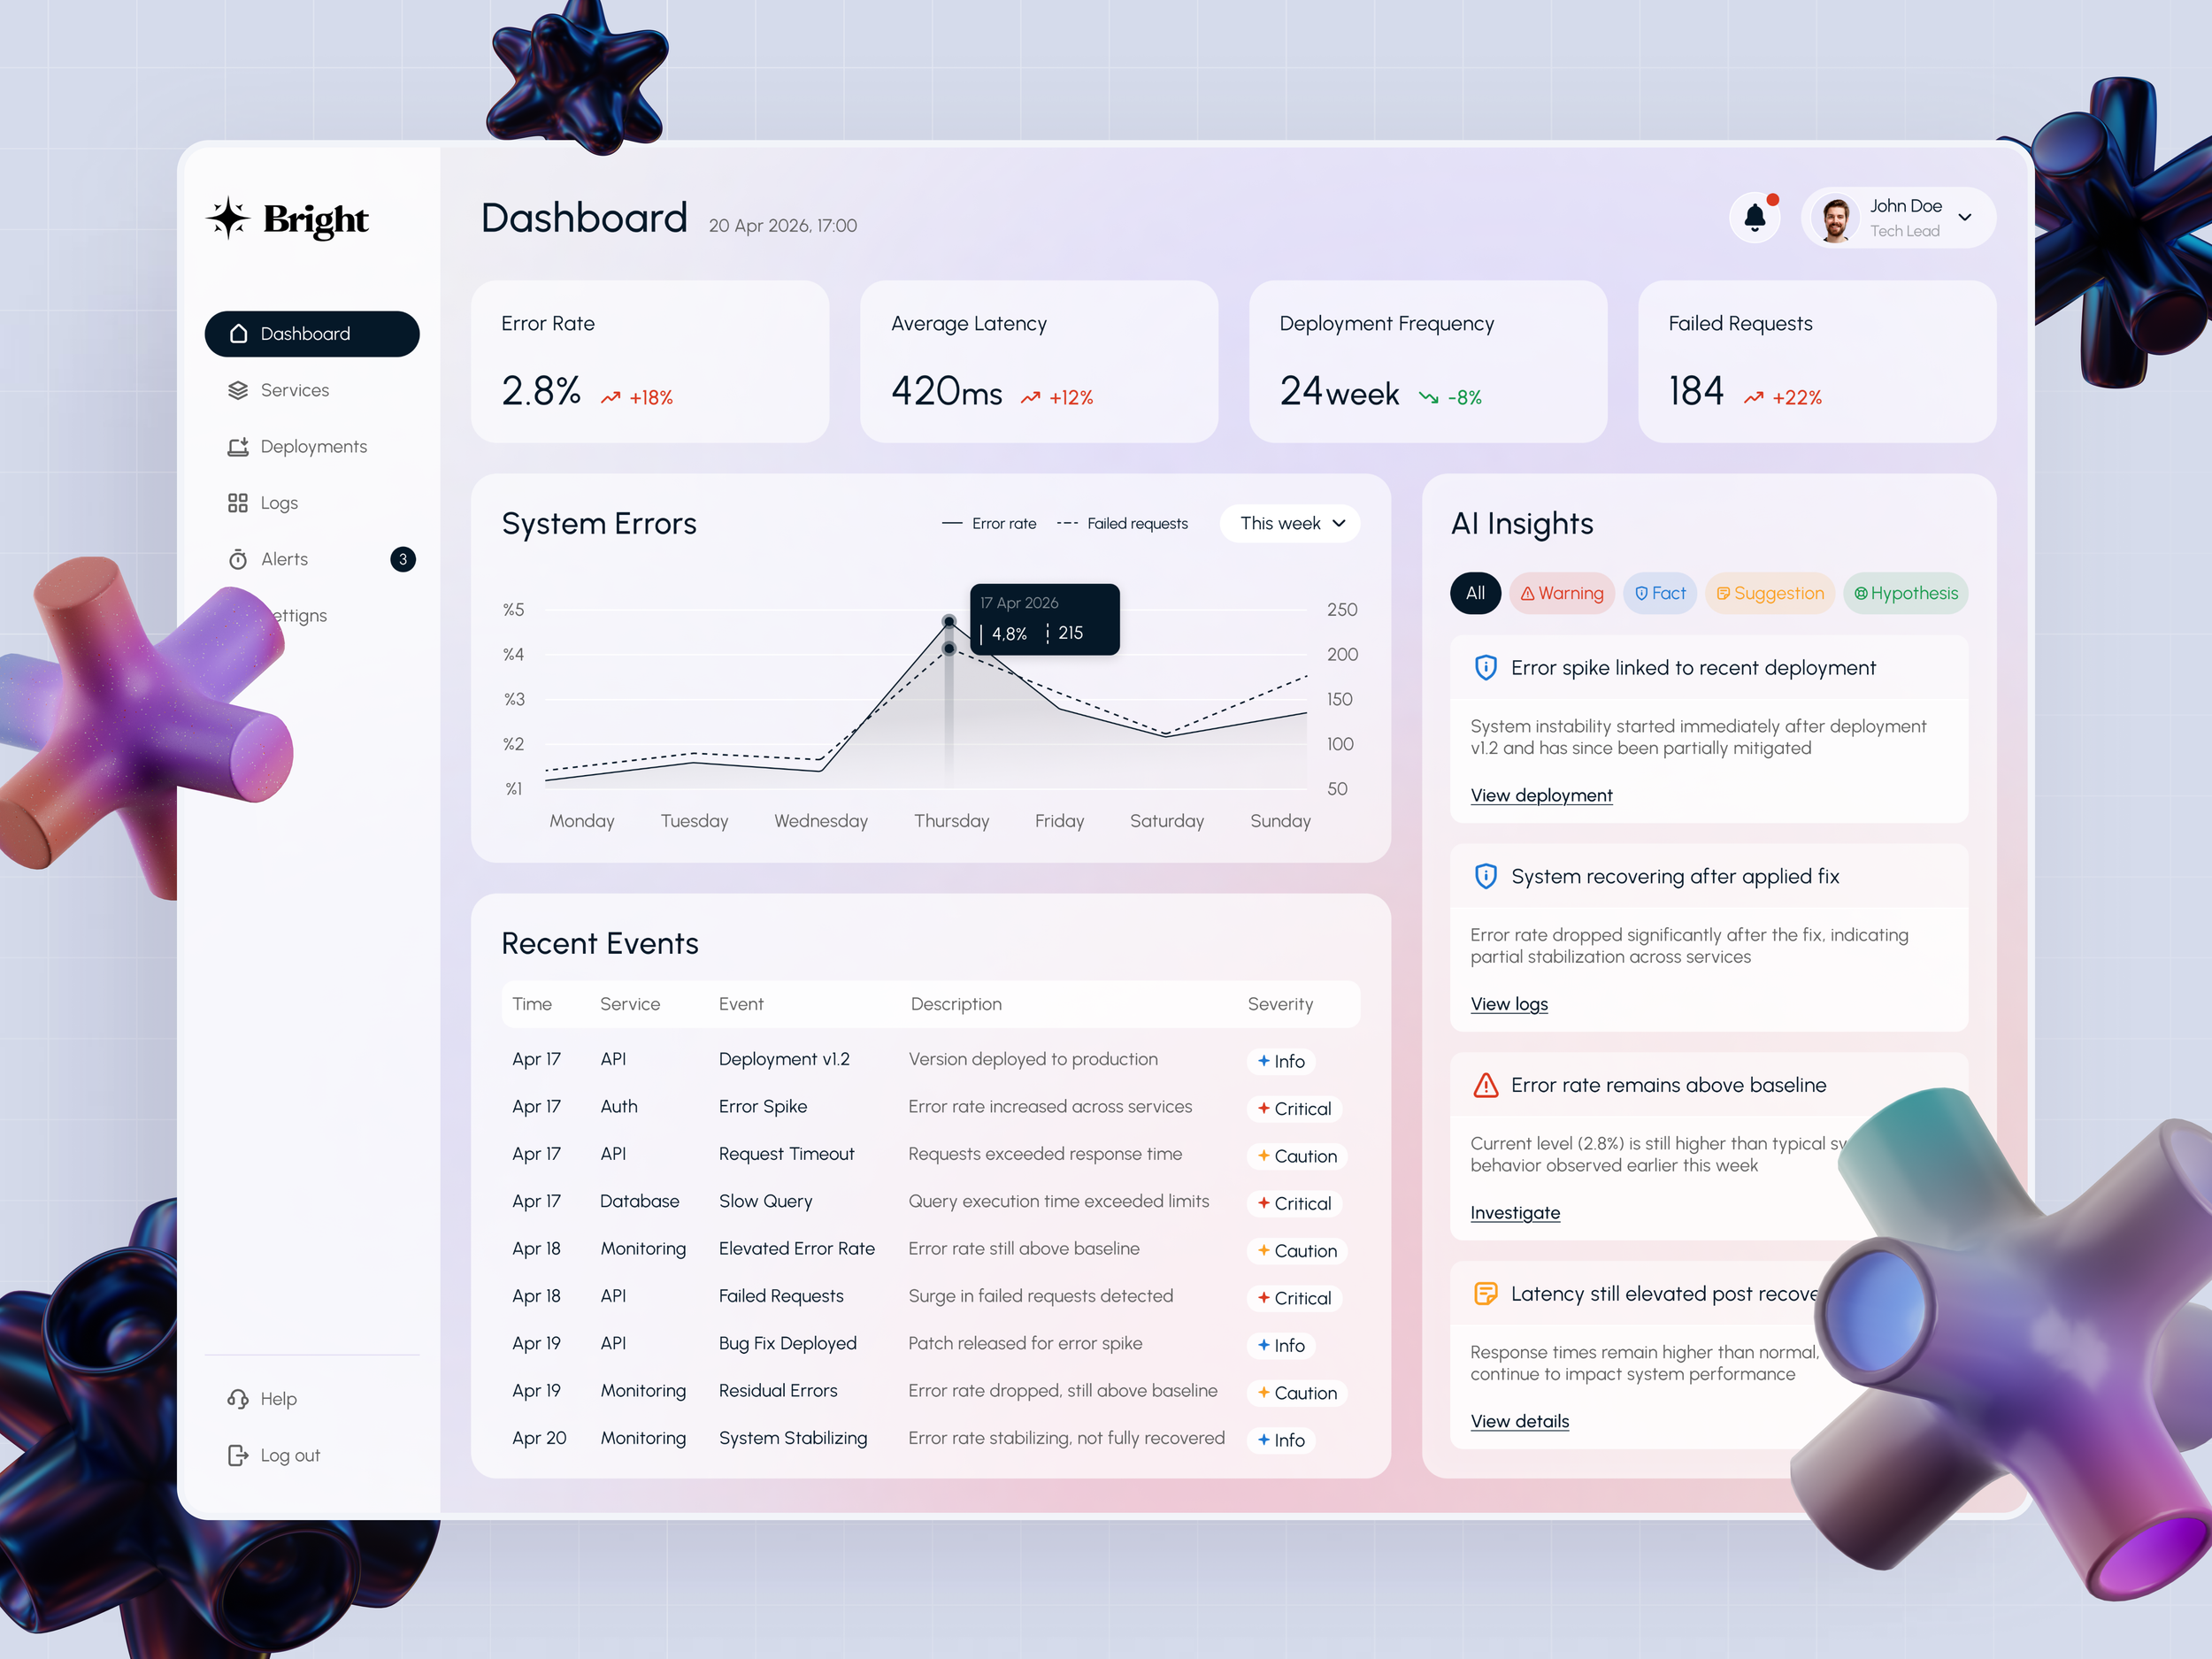
In the fast paced world of backend infrastructure, proactively managing system health is critical for DevOps engineers, backend developers, and technical leads. To address this challenge, I led the design of an AI powered performance monitoring dashboard for a leading SaaS platform. This tool integrates real time system health metrics with AI driven insights, enabling users to detect and resolve issues before they impact operations.
Challenge
The main challenge was to present complex performance data in a digestible and actionable format. It was crucial to design a user centric dashboard that balanced the need for detailed technical insights with ease of use. Additionally, the solution had to integrate AI powered predictive insights to help teams take proactive actions rather than just reacting to issues.
Design Approach
I followed a data driven design approach that emphasized user centric decision making. The process included in depth user research, close collaboration with engineering teams, and iterative prototyping to ensure we created a solution that was both scalable and intuitive.
User Research & Problem Framing;
Through extensive interviews with DevOps engineers and technical leads, I identified the need for a solution that would reduce decision making time by presenting real time performance data and actionable insights in a clear, easy to understand manner.
Product Strategy & Feature Prioritization;
The project’s focus was on creating a dashboard that provided real-time system health monitoring with predictive insights. The AI driven insights would help users identify potential issues before they escalated, providing a proactive rather than reactive approach to system management.
Prototyping and Validation;
After conceptualizing initial wireframes, I created high fidelity prototypes that incorporated both AI insights and real time data, followed by testing with real users to refine the experience. The feedback from these sessions helped fine tune the design and ensure it met user needs without overwhelming them with excessive data.
Outcome
The design improvements led to positive feedback from users, who appreciated the clarity of the AI insights and the ability to take action based on predictive alerts. The KPI cards and real time charts allowed teams to manage system health more efficiently and with less effort.
AI driven predictive insights helped teams identify and resolve issues before they escalated, leading to a 30% reduction in system downtime and improving operational efficiency.
The dashboard provided real time system health data, which improved operational efficiency. Teams reported a 25% faster resolution time due to early identification of performance issues.

What I Learned From This Project?
The biggest lesson was ensuring that AI powered insights were actionable but not overwhelming. Simplicity in presentation and a focus on the user’s needs made the dashboard more effective. The predictive capabilities of the AI insights were crucial for improving system performance and preventing downtime.
What’s Next for the Dashboard?
Future versions of the dashboard could include more advanced AI features, such as automated recommendations based on system trends, or even self healing systems that automatically resolve issues.
The dashboard could be enhanced by allowing the display to be tailored based on specific needs, enabling the prioritization of certain metrics or insights.